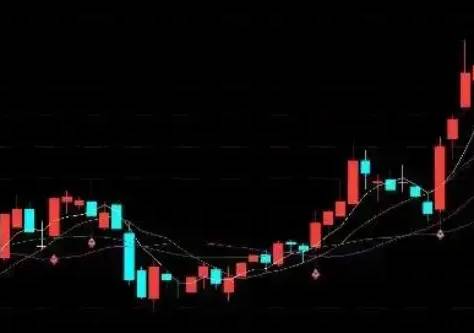
The Moving Average System, in the stock investment market, can be said to be an essential parameter indicator.
Although a small group of technical analysts highly advocate for "naked K" trading, for most investors, the moving average system is much more practical than the K-line system.
Because K-lines often have certain deceptive lines in short cycles, which greatly test the mentality of investors.
However, in the moving average system, the situation of indicator distortion is very rare, the direction and trend will be more clear, and the strength and weakness signals will also be clearer.
This is the biggest difference between moving averages and K-lines in actual combat, and also the reason why the moving average system is more favored.
Let's talk about the essence of the moving average.
Only by thoroughly understanding the essence of the moving average can we understand the logic of its application in actual combat.
The moving average is an indicator line composed of the average closing price of K-lines within a certain period.
For example.The closing prices of a stock over five consecutive days are 10 yuan, 10.1 yuan, 10.2 yuan, 10.1 yuan, and 10 yuan. The price of the 5-day moving average is 10.1 yuan.
If on the sixth day, the closing price is 10.2 yuan, the moving average calculation must exclude the first day's 10 yuan and add the last day's 10.2 yuan, recalculating to obtain a value of 10.12 yuan.
The 5-day moving average always calculates the average closing price of the most recent five trading days.
Similarly, the 10-day moving average represents the average price line over 10 trading days, the 20-day moving average represents the average price line over 20 trading days, and the 30-day moving average represents the average price line over 30 trading days...
And so on.
Based on the characteristics of the moving average, it is evident that the direction of the moving average price represents the trend of the cycle's development.
If the moving average is rising, it indicates that the stock price within the cycle is increasing, and the trend is upward.
Although there may be significant fluctuations in the short term, it does not affect the overall development trend of the stock price within the cycle.
The "representativeness" of the moving average stems from this characteristic.
The moving average can represent the trend of the stock price, and the longer the moving average, the stronger its representation of the trend.Usually, the 5-day and 10-day moving averages represent the short term, the 20-day and 30-day represent the medium term, and the 60-day and 120-day represent the long term.
Based on the nature of the moving averages, there arises the so-called distinction between the strength and weakness of the trend.
The distinction between strength and weakness mainly lies in three important dimensions.
Dimension 1: The direction of the moving average.
The direction of the moving average is actually the easiest to understand.
When the moving average is rising, it represents that the average price is continuously increasing.
As long as the average price is rising, it represents that the probability of profit for those who bought earlier is very high.
For example, if the moving average price 20 days ago was 10 yuan, and 20 days later it is 10.5 yuan, then the average profit for the investors who bought 20 days ago is 5%.
Of course, it is not excluded that in the fluctuation, some investors may buy above 10.5 yuan, but as long as the moving average is still rising, it represents that the average price of the stock is increasing, the probability of making money is very high, and the probability of losing money is getting lower and lower.Moving averages, although they are results, also represent trends. Investing in line with trends means going with the flow. On the contrary, if the moving average continues to decline, the stock price will be in a situation where it seems to have no bottom. Especially when the stock price is falling along with the moving average, it often represents buying and getting trapped, which is very dangerous. Do not blindly trade in a downward trend, as the risk will far outweigh the opportunity.
Dimension 2: The relationship between stock price and moving average.
The relationship between the stock price and the moving average also represents the strength of the stock. Regardless of the direction of the moving average, the relationship between the stock price and the moving average determines the current profit and loss situation. For example, if the 10-day moving average price is 10 yuan and today's closing stock price is 9.6 yuan, this means that the funds that entered the market in the last 10 trading days have an average floating loss of 4%. If the moving average price is 10 yuan and the closing price is 12 yuan, it represents a significant floating profit of 20% for the funds.It is important to understand that in the stock market, unrealized gains and losses have significant implications for the pressure on funds and the future direction of stock prices.
Funds will deliberately push the stock price below the moving average only during the accumulation and washing phases, but not for a long period.
In fact, within a certain period, if funds want to make a market, they must maintain the stock price operating above the moving average.
Allowing retail investors to have some unrealized gains is actually beneficial to the development of the market.
Otherwise, the trapped positions will bring a lot of pressure, which is not conducive to raising the stock price and also hinders the operation of the main force.
Dimension 3: The arrangement and distribution of moving averages.
The last but not least important dimension is the arrangement and distribution of moving averages.
In fact, there are only three types of moving average arrangements: bullish, bearish, and mixed.
Bullish arrangement is the strongest upward trend arrangement.
5-day, 10-day, 20-day, 30-day, 60-day, 120-day, with short-term on top and long-term at the bottom.This represents the short-term stock price, which rises more rapidly than the long-term stock price. The funds entering at various cycles have all achieved profits.
Such a situation is naturally within a major uptrend.
A bearish arrangement is the weakest downward arrangement in the trend.
In the bearish arrangement, each moving average cycle is losing money, which means that buying is trapped, and there is no opportunity for profit.
In the bearish arrangement, every time the stock price approaches the moving average, it is an opportunity to sell.
To achieve a reversal from bear to bull, the key lies in whether the moving average can effectively turn upward.
The rise of the K-line, if it cannot continue to drive the rise of the moving average, is a false proposition, representing that the trend of capital outflow is still fleeing.
Bull and bear interweaving is actually the most common moving average arrangement.
Because the stock price cannot always have a large increase or decrease.
Most of the time, the stock price will fluctuate back and forth within a so-called range.Long-term moving averages, such as the 60-day and 120-day, have a very limited reference value.
The arrangement of the 5-day, 10-day, and 20-day moving averages is a primary factor for judging the strength of the bulls and bears in the short term.
In a market with intertwined long and short positions, one should look at the direction of short-term market changes.
If you can't understand it, it is recommended to reduce participation, as the uncertainty of the trend changes in this stage is particularly strong.
When capital cannot influence the overall market, it will also choose to sell high and buy low, repeatedly "cutting the leeks" (a metaphor for taking advantage of less experienced traders).
Finally, a reminder that moving averages are not omnipotent, because they are outcome indicators.
In simple terms, moving averages are a result, not a process, and they cannot predict the future with 100% certainty.
The effectiveness of moving averages lies in their ability to determine the trend direction through the relationship of prices.
For larger capital, the trend will not change easily and requires a time cycle.It is precisely for this reason that the trend's direction determines the most likely direction of stock price movement.
Using moving averages to judge the market trend is essentially based on the traces of moving averages left by large capital operations in stocks.
However, moving averages are lagging indicators and can never be one step ahead of others.
Properly utilizing moving averages can better assist in making many judgments in practical combat, effectively increasing the success rate of transactions.
In fact, there are many ways to apply moving averages, such as overbought and oversold conditions, but due to limited space, we will discuss them another time.

